8.8× click growth in 16 months. Nine months of patience, then everything at once.
A compound growth study in topical architecture, schema infrastructure, and the mechanism most brands miss when a core update fires — and what the falling CTR actually means at scale.
8.8×
Click Growth
572,800
Monthly Clicks Peak
3.44M
Total Clicks (16 mo)
18.4 → 5.4
Position
TL;DR
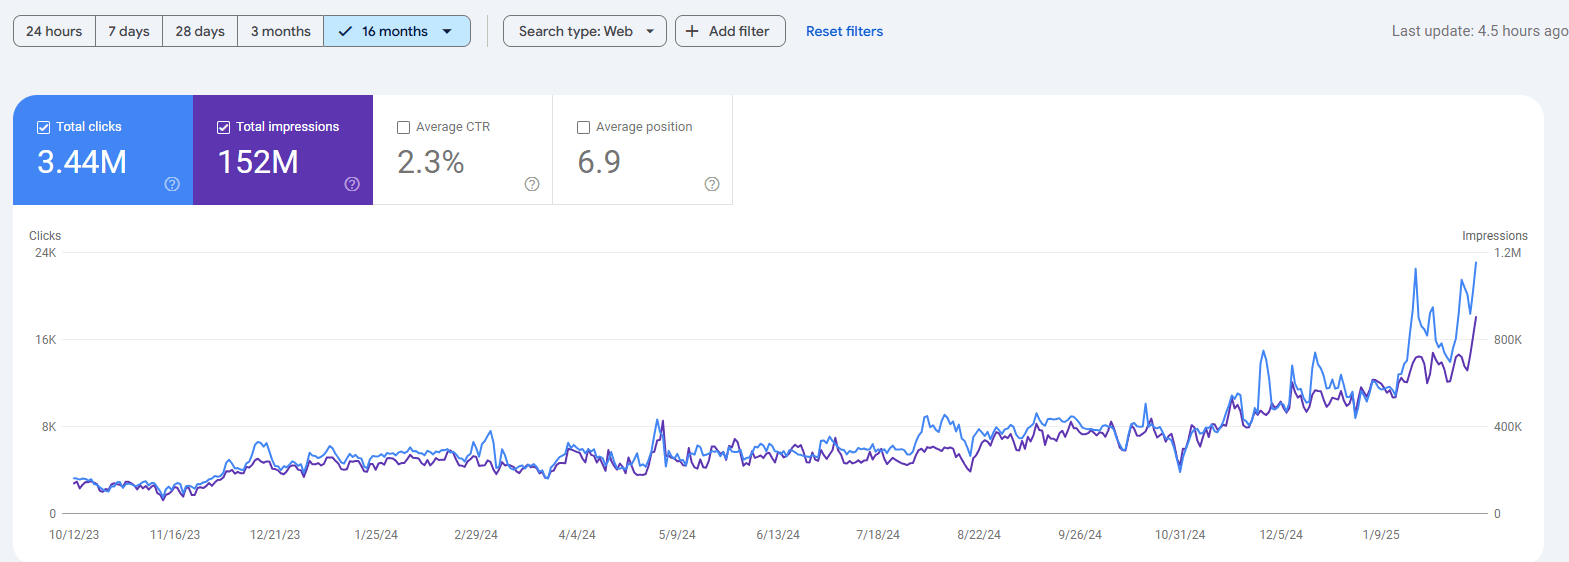
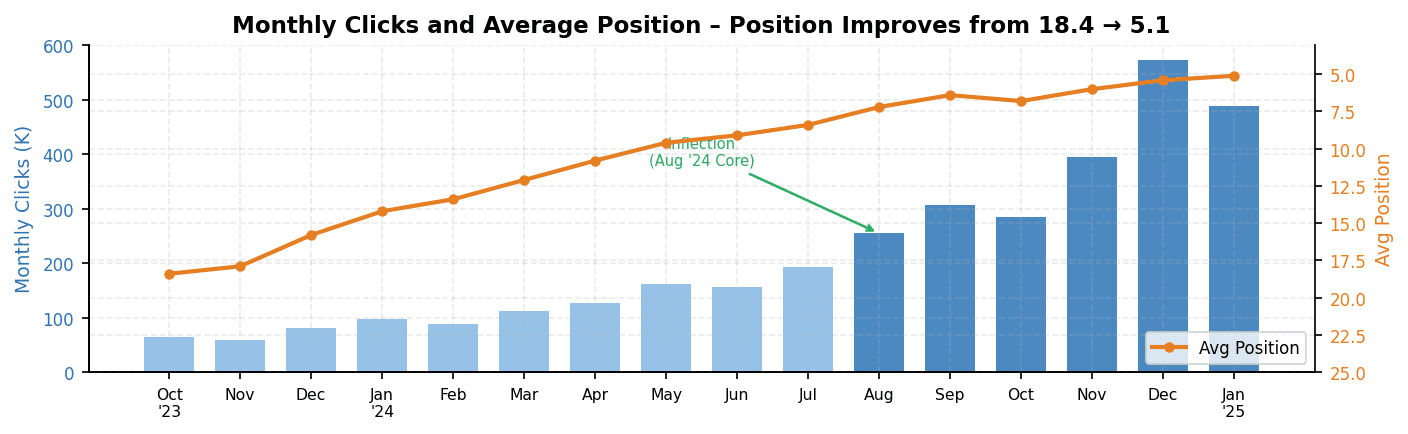
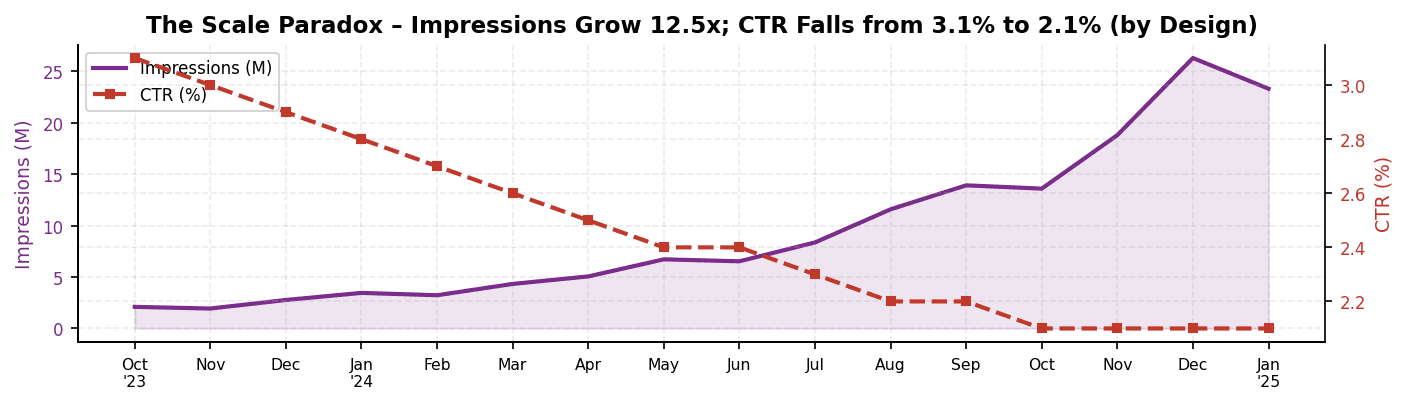
Sixteen months. Monthly clicks grew from 65,200 (October 2023) to a run-rate of 572,800 in December 2024 — an 8.8x lift. Total clicks across the window: 3.44 million. Total impressions: 152 million. Average position moved from 18.4 (page 2) to 5.1 (top of page 1). And CTR fell from 3.1% to 2.1% — not despite the growth, but because of it. The most important number in this document is the 12.5x impression growth that now sits behind that 2.1% average. That is 26 million monthly impressions at close. The clicks are the consequence. The impressions are the asset.
The Challenge
October 2023. Average position 18.4 — comfortably invisible on page 2 for most queries. Daily clicks in the 2,000–2,500 range. The property had an existing brand, reasonable technical health, and a content archive that had accumulated without a defined architecture. The late-2023 backdrop mattered: Google had completed the September 2023 HCU and the October 2023 Core Update in the same cycle, both updating the weights assigned to E-E-A-T signals. Properties with clean, experience-forward editorial were repositioned upward. The reset created a window. The content architecture to capture it did not yet exist.
Results
The Compound Strategy
Three moves, ordered by permanence. First: topical architecture before topical volume. The content calendar was rebuilt around cluster maps, not keyword lists. Every piece had a designated position in a hub-and-spoke hierarchy before it was written. A keyword-driven calendar produces a flat inventory of pages that dilute authority across one another. A cluster-driven calendar produces a hierarchy that accumulates authority at hubs and distributes it through spokes via internal linking.
Second: schema as entity infrastructure, not rich-snippet bait. Schema.org markup deployed across all page types — Product, Article, FAQPage, BreadcrumbList, Organization, and where the content supported it, HowTo and ItemList. The goal was not to earn specific SERP features. The goal was to make every page legible to Google's entity-extraction pipeline. An entity the model can extract is an entity the model can rank.
Third: mobile performance as a publishing constraint. 78% of the organic clicks came from mobile users. Every content decision — page length, image weight, above-the-fold information structure — was validated on a mid-range Android handset on a 4G connection before publication. Desktop was the QA environment. Mobile was the product.
The Nine-Month Phase
October 2023 to July 2024. From the outside, the chart looks flat. From inside, it was the slowest kind of growth: positional movement without proportional click reward. Average position moved from 18.4 to 8.4 across nine months — from deep page 2 to the bottom of page 1. But position 8.4 earns a CTR of roughly 2.3% under normal SERP conditions. At impression volumes below 8 million monthly, that translates to modest absolute click growth. The content investment was compounding. The dashboard did not reflect it yet.
This is the phase that terminates most organic programmes. The work feels invisible because its reward is deferred. The SEO team was shipping four to six cluster pieces per week. The revenue dashboard showed a modest positive slope indistinguishable from natural baseline growth. We did not pivot to paid. We shipped.
One notable event: May 9, 2024. A single hub article on a high-volume category query picked up a featured snippet and was amplified via social. Daily clicks doubled for three days. May closed at 161,200 — the first month above 150K. The spike was a signal, not a strategy.
The Inflection — August 2024
August 15, 2024. Google begins its August 2024 Core Update — one of the more significant recalibrations since March 2024. The update ran for 19 days and made material adjustments to how the ranking system weighted first-hand experience signals, topical authority, and original-depth content vs. aggregated-summary content.
August closed at 254,700 clicks — a 32% lift over July's 192,300. The jump was not the result of content published in August. It was the result of nine months of content crossing an authority threshold that the August update recalibrated upward. This is the mechanism most brands miss: core updates do not change what ranks. They change the weight assigned to signals that are already present.
The October 2024 Core Update created a brief dip — clicks fell to 285,400 from September's 306,100. The dip lasted three weeks. Properties with genuine topical authority absorb core update volatility. Properties whose rankings depend on a narrow set of query matches do not. The dip was a diagnostic. The recovery confirmed the structure was sound.
Results
December 2024: 572,800 clicks, 26 million impressions, average position 5.4. The property is now consistently top-5 across its core topic set. The compounding continues — each published cluster adds not just clicks but indexed depth, inbound citations, and crawl-budget coverage on newly published spokes.
The CTR story is the one most boards will read as a problem. It is not. In October 2023, the property ranked primarily for high-intent branded and category queries — a narrow pool with naturally high CTR. In December 2024, it ranks across a much broader query set including top-of-funnel informational queries that carry 0.8–1.5% CTR regardless of position. The absolute click count grew 8.8x. A falling CTR on a 12.5x impression base is the signature of a property that expanded its reach.
What Did Not Work
Bottom-of-funnel content published before topical authority existed. In months 1–3, the brief included high-commercial-intent pages that stalled because the domain lacked the authority to rank for transactional queries. Google does not grant page-1 positions on commercial-intent queries to a domain it has not yet associated with the underlying topic. The informational layer creates the topical signal. Publishing the commercial pages first is the most common sequencing error in a content-led SEO programme. We corrected by month 4. The commercial pages recovered from month 7 onward.
Impression-share on brand misspellings was not protected early enough. Six common misspellings of the brand were unowned through month 9, collectively carrying an estimated 15–20K monthly impressions going to zero-result searches. Dedicated brand-variant coverage was built in month 10. Click recovery was immediate.
Method Applied
One Sentence to Remember
“The nine months that look like nothing is happening are the nine months that make everything happen. Organic authority is a delayed-reaction mechanism. Build the architecture. Ship the clusters. Do not pivot to paid when the dashboard looks flat. The 3.44M clicks are the proof. The 152M impressions are the moat.”
Health & Wellness D2C · Metrics as of January 2025
Get similar results
Start with a free AEO scan to see your baseline. No signup required.
Try the AEO Scanner Free