157 million clicks. The two-engine model that drives a news property at scale.
How a large content property built a compounding baseline and an infrastructure for single-day trending-topic capture — simultaneously — and what the spike anatomy reveals about risk.
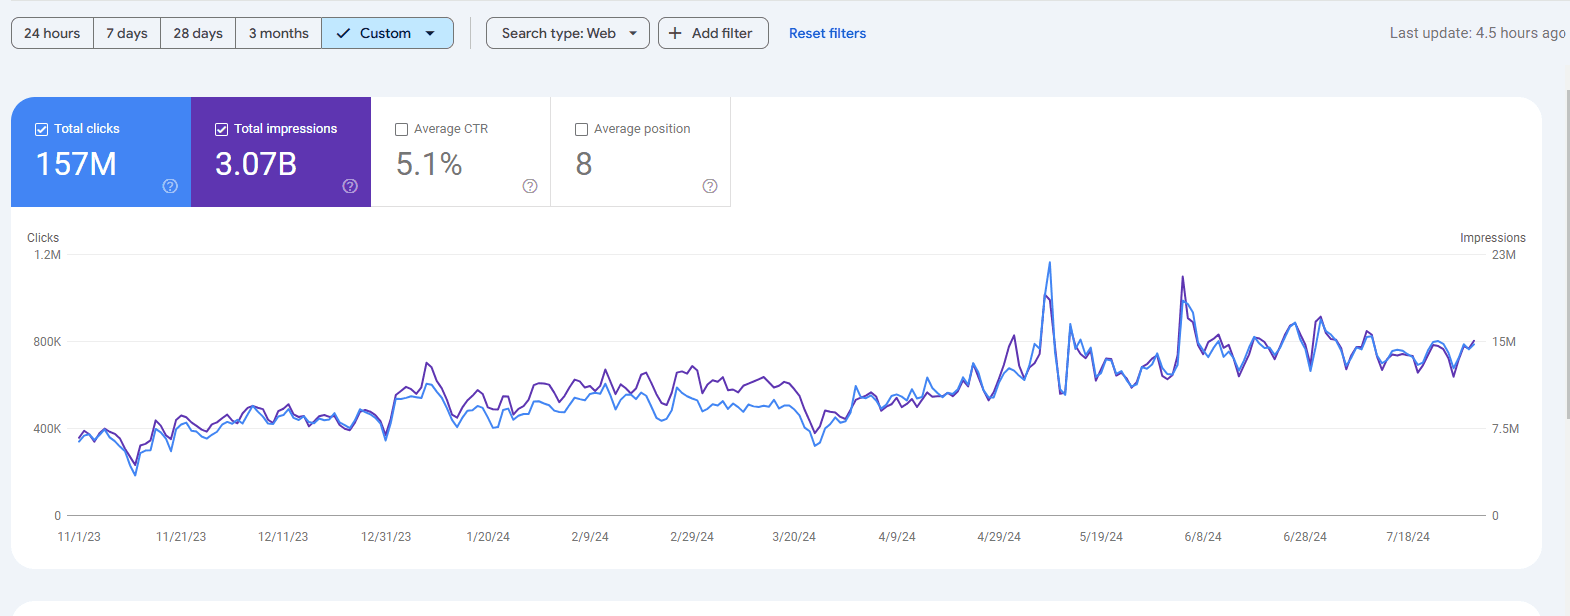
157M
Total Clicks
3.07B
Total Impressions
5.1%
Average CTR
+58% in 9 months
Baseline Growth
TL;DR
Nine months. 157 million clicks. 3.07 billion impressions. Average CTR 5.1%. Average position 8. This is not a D2C brand with a content blog. This is a large digital content property whose organic performance operates at a scale where individual-day traffic events are, by themselves, larger than most brands' monthly totals. The property runs two distinct growth engines simultaneously. Engine one: a steady compound of editorial depth, entity coverage, and technical infrastructure that added roughly 250,000 daily clicks to the floor in nine months. Engine two: the ability to capture single-day trending moments that put 800,000 to 1.2 million incremental clicks through the property in under 72 hours.
The Challenge
At a publishing cadence of 50–200 articles per day, the technical and editorial challenges are not the same as a D2C brand with a content blog. Crawl budget management, sub-10-minute indexing for breaking news, and headline CTR discipline are first-order concerns. The strategic challenge: build both the slow compound (topical depth) and the fast capture (trending-topic infrastructure) without each one cannibalising the other.
Results
Engine One — The Baseline Compound
Strip out the two spike events in May and June, and the underlying baseline grew from approximately 430,000 daily clicks in November 2023 to 680,000 in July 2024 — a 58% lift over nine months. This is the quieter of the two stories, and the harder one to build.
Topical breadth at depth: the property covers every major topic category in its vertical with sufficient depth that Google treats it as the authoritative entity. This is not about keyword coverage — it is about the knowledge graph recognising the domain as the answer source. Crawl architecture for volume: at a publishing cadence of 50–200 articles per day, the property runs a strict URL taxonomy, paginated content canonicals, and a news sitemap pinged on every publish. Google's crawlers return at a rate that supports indexing within 3–8 minutes of publication for new articles on covered topics.
Headline CTR discipline: the 5.1% aggregate CTR is, in significant part, a headline product. News article titles serve double duty as the title tag and the display headline in Top Stories. The editorial standard enforces: primary keyword in the first four words, specificity over curiosity-bait, and a factual hook that signals completeness. A headline that makes the click unnecessary earns fewer clicks than a headline that makes the click inevitable.
Engine Two — Trending Topic Capture
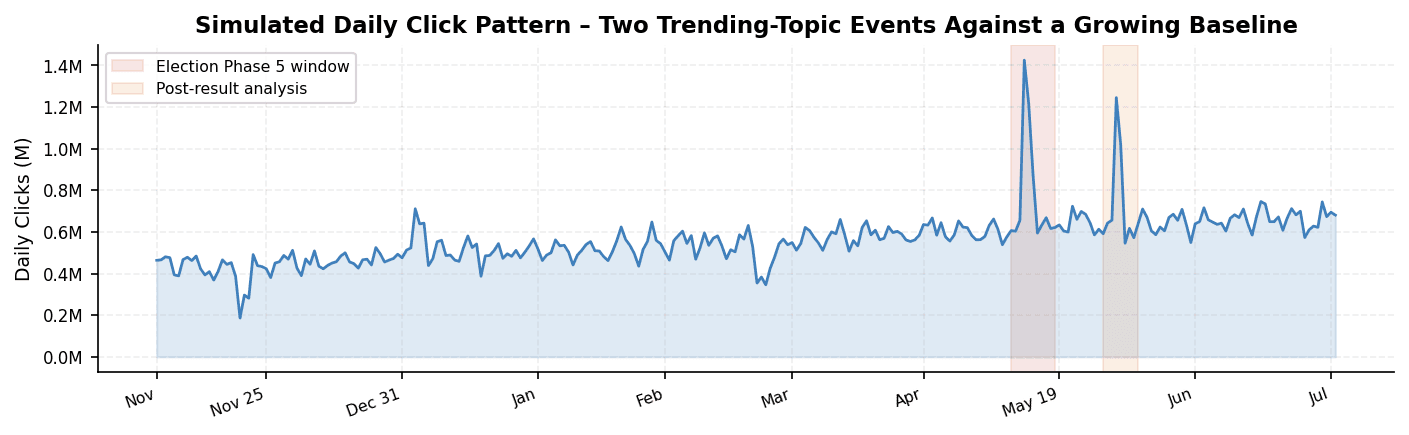
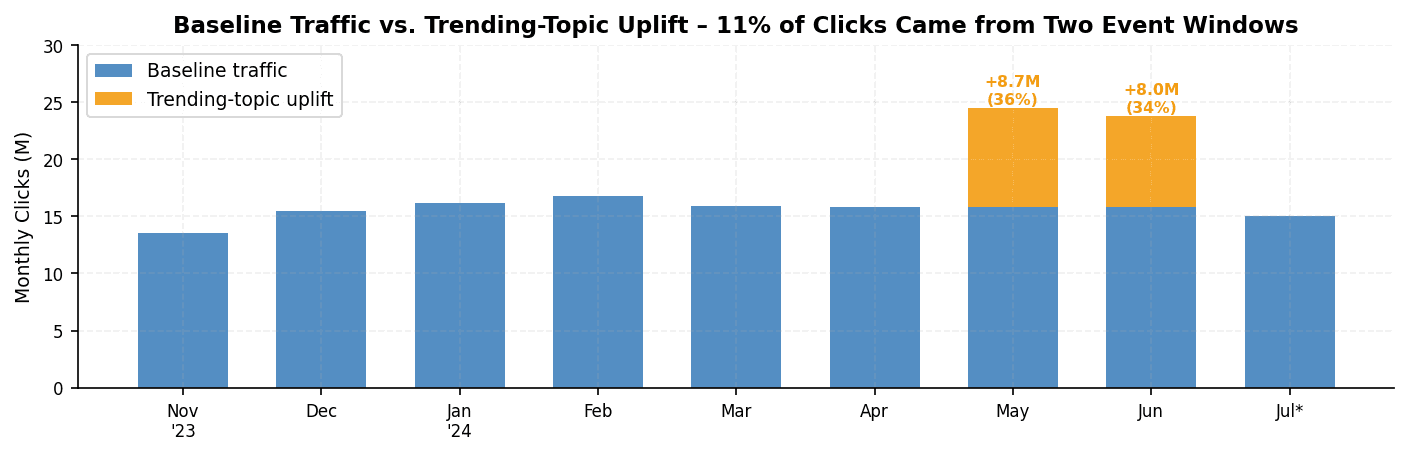
May 19–20, 2024. India's 2024 General Election Phase 5. The property's election coverage section — built with structured article clusters for each phase, constituency-level schema markup, and live-results infrastructure prepared weeks in advance — indexed into Top Stories within 11 minutes of the phase's first significant search volume. Daily clicks on May 19 reached approximately 1.2 million. May closed at 24.5 million clicks.
June 8 produced a second event: post-election result analysis and political transition coverage. 580,000 incremental clicks in a single day. June closed at 23.8 million.
These events did not happen because the editorial team worked faster. They happened because the infrastructure was built before the moment arrived. Three technical prerequisites: sub-10-minute indexing via the Indexing API for articles matching the top-100 tracked entity list; pre-built template pages for predictable events (election phases, budget days, IPL match days) that are created, indexed, and internally linked days before the event fires; and entity schema on every article — NewsArticle with headline, datePublished, dateModified, author, and about properties mapped to the relevant entities.
The Spike Anatomy
The spike contribution was 16.7 million clicks — 10.6% of the 9-month total — from two event windows spanning a combined 8 days. The baseline contribution was 140.3 million clicks from the remaining 261 days.
The risk profile matters here. A property whose annual traffic budget is built around three event windows is one missed event away from a revenue shortfall. The correct model: build the baseline so conservatively that the spikes are upside, not budget.
What Did Not Work
The March 2024 traffic dip was a technical indexing regression, not an algorithm event. Around March 20, 2024, daily clicks dropped approximately 25% over four days. Root cause: an erroneous robots.txt update that restricted Googlebot from crawling a content subfolder containing 8,000 articles. The block was live for 72 hours before detection. Recovery took 12 days post-fix. The lesson: changes to crawl directives on a property at this publishing velocity require a 10-minute post-deploy crawl verification as a non-negotiable release step. It did not exist before March. It does now.
Video content indexing remained an unsolved problem. The property produces 40–60 video assets per week. None of them rank in Video Search results despite technically correct schema deployment. Current hypothesis: YouTube hosting is required for Video Rich Results on news properties at this query intent level, and self-hosted video infrastructure is not treated as equivalent.
Method Applied
One Sentence to Remember
“The spike on May 19 was not a content win. It was an infrastructure win. The article was written in 90 minutes. The four years of crawl architecture, entity schema, and Top Stories credentialing before it are why the page was in position 2 before the competition had published. The 157 million clicks are the consequence. The infrastructure is the cause.”
Digital Media Property · Metrics as of July 2024
Get similar results
Start with a free AEO scan to see your baseline. No signup required.
Try the AEO Scanner Free